Charts are pretty cool guys, they allow you to display data in a more visual manner that makes it easy to understand and compare. Here's how to you can embed a chart in your Excel spreadsheet.
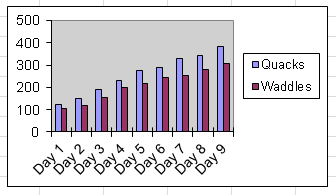
Here's the chart you'll create.
Select your language below to view the source. You can download Number Duck here, along with source code to all the examples.
C++C#C++
#include "../NumberDuck.hpp"

#include <string>
#include <stdio.h>
#include <stdlib.h>

using namespace NumberDuck;

int main(int argc, char **argv)
{
	printf("Chart Example\n");
	printf("Embed a chart in a spreadsheet!\n\n");

	Workbook* pWorkbook = new Workbook(Workbook::License::AGPL);
	Worksheet* pWorksheet = pWorkbook->GetWorksheetByIndex(0);

	Cell* pCell = pWorksheet->GetCellByAddress("A1");
	pCell->SetString("Duck Productivity");

	// filling out the table of data
		pWorksheet->GetCellByAddress("B2")->SetString("Quacks");
		pWorksheet->GetCellByAddress("C2")->SetString("Waddles");

		int nQuacks = 90;
		int nWaddles = 70;
		for (int i = 0; i <  9; i++)
		{
			char szTemp[100];
			sprintf(szTemp,"Day %d", i+1);
			nQuacks += int(rand()%50);
			nWaddles += int(rand()%50);

			pWorksheet->GetCell(0, i+2)->SetString(szTemp);
			pWorksheet->GetCell(1, i+2)->SetFloat(nQuacks);
			pWorksheet->GetCell(2, i+2)->SetFloat(nWaddles);
		}

	// create the chart
	Chart* pChart = pWorksheet->CreateChart(Chart::TYPE_COLUMN);

	// set cell position for the chart
	pChart->SetX(3);
	pChart->SetY(1);

	// center the chart within the cell
	pChart->SetSubX(Worksheet::DEFAULT_COLUMN_WIDTH / 2);
	pChart->SetSubY(Worksheet::DEFAULT_ROW_HEIGHT / 2);

	pChart->SetWidth(Worksheet::DEFAULT_COLUMN_WIDTH*5);
	pChart->SetHeight(Worksheet::DEFAULT_ROW_HEIGHT*9);

	pChart->SetCategories("=A3:A11");

	// Create the 'quacks' series
	Series* pSeries = pChart->CreateSeries("=B3:B11");
	pSeries->SetName("=B2");

	// Create the 'waddles' series
	pSeries = pChart->CreateSeries("=C3:C11");
	pSeries->SetName("=C2");


	pWorkbook->Save("ChartExample.xls", Workbook::FileType::XLS);

	delete pWorkbook;

	return 0;
}